| 2007 - Q3 - September 30 Energy Commentary — Peter Hanley |
|
U.S. recession risks have risen sharply in a short period of time although it is difficult to tell how key issues in the macro environment (sub-prime, housing, tightening liquidity, etc.) will play out. Federal Reserve Chairman Bernanke judges the risk of a U.S. recession as “greater than one-third.” Obviously, an accelerating downturn in the US/global economic growth picture could ease oil demand growth and cause energy prices to ease somewhat. Any U.S. slowdown will have a muted effect compared with slowdown/recessionary periods in the past. This is because only a small portion of current demand growth is attributable to the United States and is now more concentrated in non-OECD countries. In fact, markets for benchmark crude oils are now almost routinely exhibiting pricing structures that are symptomatic of shortages of the right kind of crude oil in the right place. These historically high prices are not achieving anything like the whole-sale demand side upheaval that was brought about in the 1970’s and early 1980’s as energy demand in emerging markets continues to keep pace with strong economic and population growth.
Chart One: Crude Oil Prices Since 1861
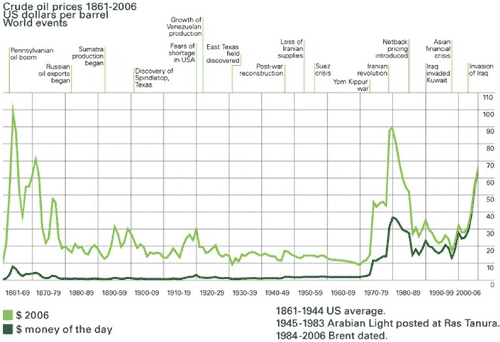
Source: BP Statistical Review of World Energy 2007
Chart Two: Crude Oil Demand Growth by Region
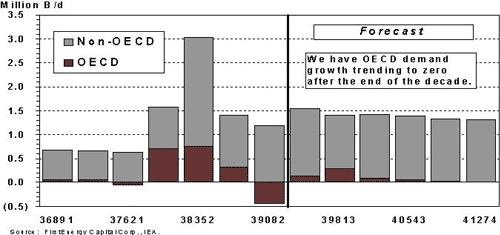
According to the BP Statistical Review of World Energy 2007, in the last five-year period (2002-2006) global energy demand grew faster than in any other five-year time-frame since the 1960-1970’s – when the now mature economies of the OECD were rapidly industrializing.
Five-Year Period Demand Growth Comparison
| |
2006 |
1976 |
| North America |
18% |
29% |
| Europe |
11% |
37% |
| Asia |
48% |
22% |
| Middle East |
16% |
4% |
So far, resilient demand growth, waning non-OPEC supply growth and questionable spare capacity in OPEC have sustained the bullish outlook for oil prices. We still have not reached the point where higher crude prices slow the growth in demand as the supply side continues to struggle to keep up with demand growth.
Chart Three: Oil Consumption per Capita
Source: BP Statistical Review of World Energy 2007
Chart Four: Estimated Global Spare Crude Oil Well Head Productive Capacity
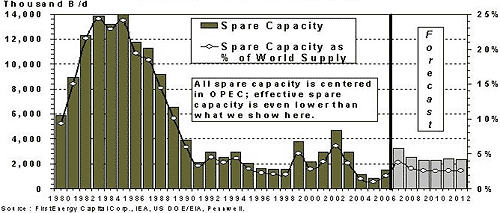
Capacity is short in many parts of the energy supply chain (upstream, refining, engineering, etc.) and the speed at which new capacity is being added is barely able to keep up with demand. This reflects a lack of adequate investment over many years. Skill and material shortages are adding to geological and geopolitical obstacles.
We have frequently emphasized that oil service costs have risen dramatically over the last number of years and this has been a key factor behind the ongoing high level of oil prices. More complexity in more challenging places drives higher costs. For example, the chief raw materials used in oil extraction are metals – steel and its related alloys such as nickel (stainless) and molybdenum. Prices for these commodities are up dramatically (e.g. stainless is up 93% since 2004). The rapid rise in utilization of key offshore assets (drilling vessels, offshore installation assets, etc.) has driven an increase in their costs as capacity in the service sector was not built for the level of activity now demanded. Labour demand has also risen dramatically for skilled and experienced people from experienced rig crews and engineers to welders.
Layered on top of that is the trend to revisit fiscal arrangements for oil and gas activities when prices rise. Fiscal take rises automatically as prices rise due to the fiscal terms themselves. New concessions are awarded on different terms than previously awarded ones. Tighter competition means oil companies bid up the terms they are willing to make up front. As access to opportunity slows there is an added premium for attractive resources. The most vexatious mechanism is retrospective adjustment whereby a host government merely changes the terms that a company operates under. The Russians (45% of total non-OPEC reserves) have paid the price for higher political risk, an increasingly unattractive fiscal environment (e.g. high export taxes) and the lack of export infrastructure. Russian production has been slowing and is not expected to grow at rates higher than 2-3%. The IEA suggests that Russia’s oil output could reach a plateau by 2010-12.
As non-OPEC supply growth continues to slow, the major oil companies, with their technological edge, have a key role to play in managing the decline rates in the more mature basins. For example, large, mature oil fields such as Mexico’s Cantarell field are facing greater than expected production declines and are difficult to manage. The field’s world-scale nitrogen based enhanced oil recovery project was expensive and appears to have run its course. The IEA estimates that Canterell output will fall by more than 60% to 650k bpd by 2012. Pemex has fallen behind both in the development of discovered conventional reserves and in exploring and developing its share of the prolific deep water Gulf of Mexico.
Chart Five: IEA Estimates of Non-OPEC Supply (Excludes Angola)
Chart Six: Oil Reserves-To-Production (R/P) Ratios
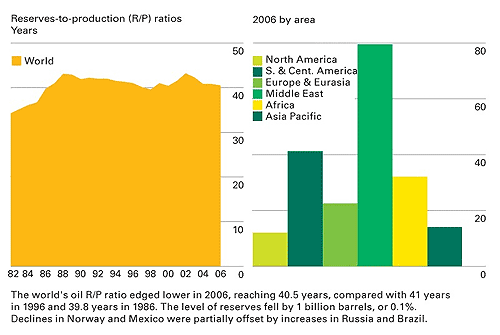
Source: BP Statistical Review of World Energy 2007
On a shorter-term basis, oil is entering its historical period of seasonal weakness where refineries go down for seasonal maintenance yet the price continues to hover in the $80/bbl range. Over this period, prices typically drift lower over the autumn months until the end of the pre-heating season.
Chart Seven
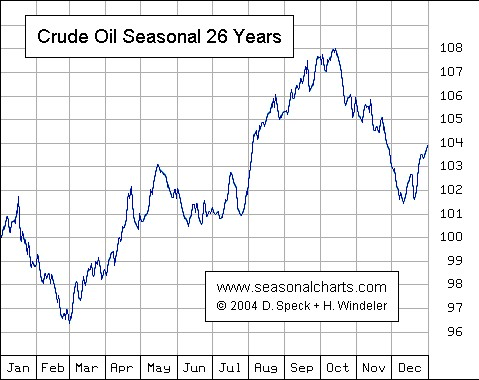
Chart Eight: U.S. Traded-Weighted Dollar since Jan. 1, 2000
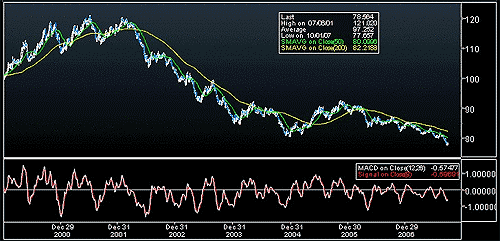
Source: Bloomberg
The continuing decline in the U.S. dollar has caused OPEC to remain conservative in production policies as it attempts to manage a decline in foreign exchange spending power. Non-U.S. consuming nations have not experienced the same degree of crude oil price inflation in their local currencies and this has underpinned demand outside the U.S. Combine this with a much higher intensity of use compared to the U.S. economy and it is easy to see why global demand has remained strong supported by the fact that so much of global economic growth is now being generated outside the OECD. Adjusting for currency and intensity of use, crude oil prices would have to rise to well over $100 per barrel before the same level of consumer pain occurs compared with what was experienced in the late 1970’s and early 1980’s.
Chart Nine: U.S. Traded-Weighted Dollar YTD - 2007
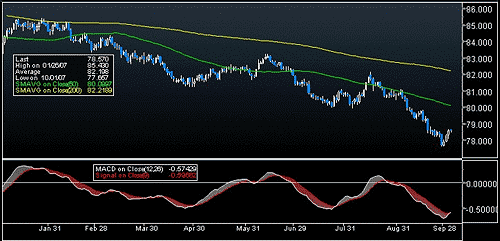
Source: Bloomberg
The traded-weighted U.S. dollar is down 6.1% so far in 2007 and down 23% during this decade. However, verses the Canadian dollar, it is down 16.8% this year and down 45% since the end of 1999. This means that the significant increase in the U.S. dollar value of crude oil does not fully translate into as large an increase for Canadian producers.
To summarize, it is hard to forecast oil prices below $55-60/bbl. for any sustainable period. Difficulties in accessing new prospects, soaring production costs and the accelerating decline from mature fields makes price spikes to $80 -$100/bbl. over the next few years not unthinkable. It would take a very deep recession to send prices down to the US$50-60 range.
Chart Ten: Natural Gas Price – YTD 2007
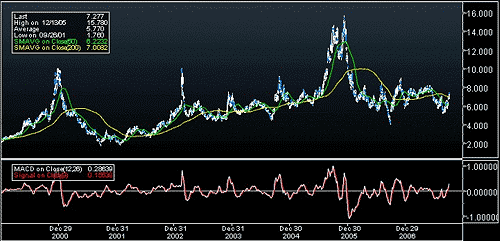
Source: Bloomberg
Natural gas is up 4.9% so far in 2007 as we enter the shoulder season.
Since the end of Q1/06, natural gas has traded in a channel ranging from $5/mcf to $8/mcf.
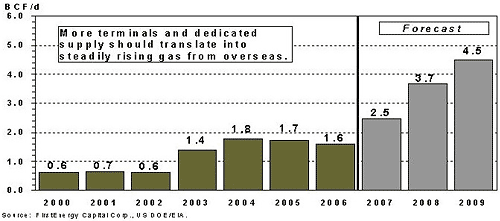
The continued influx of liquefied natural gas (LNG) imports, partially offset by declining Canadian imports, continues to influence spot prices in the U.S.
By early October, storage levels had reached 3,263 Bcf, which is 7.5% or 227 Bcf above the five-year average and 54 Bcf below last year’s levels. With roughly five weeks remaining in the injection season, if builds were to match last year or five-year average levels, it is estimated that storage would enter the winter heating season at approximately 3.4 to 3.5 Tcf.
The next six months remain uninspiring for the outlook for natural gas prices notwithstanding the typical seasonal upswing going into the winter heating season. Sentiment will be dominated by the degree of severity of the upcoming winter (as it is every year) in North America and, now Europe, due to its affect on the incremental rate at which LNG will be diverted to North America. It will require a significantly colder than normal winter to alter the currently subdued natural gas outlook for the near term.
LNG
The addition of at least five new re-gasification terminals in North America, dedicated to the U.S. market, will add to the growing influence of LNG in North America. Sizable new natural gas production is expected from the North Sea by the end of this year. Originally targeted to the already over-supplied U.K. market, much of that gas could be diverted to the U.S. In the near term, however, the Pacific Basin is facing tighter supplies and Japan has had to import additional LNG (equivalent to 150kb/d) to offset the loss of power generation due to the outage of its largest nuclear power plant.
Breakeven points for LNG projects are increasing as their costs, as we have seen in oil exploration and development, rise dramatically. Buyers are now realizing that LNG prices need to rise and more contracts are considering prices that take LNG closer to oil parity. For example, Qatar has negotiated “crude price parity” in its sale of LNG to electric utilities in both Korea and Japan.
Currently, there is a gap in the timing on new LNG projects and much of the gas under development up to 2012 has been committed. These delays mean that during the remainder of the decade we will likely see supply constraints in Asia.
Longer term, without further significant and swift new infrastructure build, Europe would also be very exposed to an unplanned reduction in supply from Russia. In that case, it would have to bid for LNG in competition with the US and Asia.
Chart Twelve: U.S. Annual Average Imports of LNG
COSTS
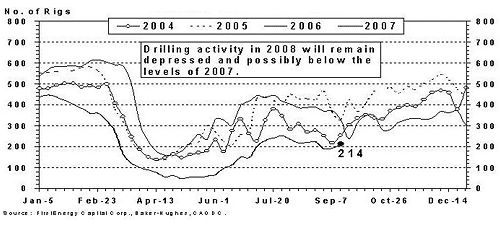
Although the degree of drilling in the U.S. remained stronger for longer than expected, recent data suggests that the weak pricing environment may finally be impacting the cash flow and spending plans of U.S. producers. A number of medium and large U.S. natural gas producers (e.g. Chesapeake) have announced cuts in their 2008 capital programs.
Chart Thirteen: U.S. Gas Directed Drilling Rig Count
High cost Western Canada will continue to cause less drilling and more capital expenditure cuts which, combined with possible growing supply losses in the U.S., could tilt North American natural gas supply towards a tighter picture if these losses are not fully offset by additional LNG imports.
Chart Fourteen: Estimated Western Canada Natural Gas Directed Drilling Rig Count
In summary, the near term outlook for natural gas prices in North America remain subdued. Just when the “perfect storm” of increased taxes on oil & gas royalty trusts, milder winter weather, higher finding, development and operating costs and subdued hurricane activity in the GOM all combined to impact Canadian natural gas producers, we now have the added headwinds of currency parity with the U.S., increasing competition from LNG, and increased royalties planned by the Alberta provincial government (see “OUR FAIR SHAIR” Alberta Royalty Review below).
This will mean that Canadian producers will continue to face more difficult times going forward notwithstanding a seasonal recovery in natural gas prices. However, in the longer term, natural gas prices will have to rise to ensure viable economics for new projects as breakevens increase and as competition from LNG is lessened due to its own escalating cost structure. High oil prices are having a significant impact on natural gas pricing and, over the next five years, it is likely that gas prices will align with oil prices.
“OUR FAIR SHAIR” Alberta Royalty Review
Based on recent experience, any time we hear the word “fair” or “fairness” when governments are reviewing taxation, we hold our breath in anticipation of how big the fiscal damage will be. This time it was Alberta’s turn, and the provincial government did not disappoint. Regardless of recent polls (Ipsos Reid) showing that Albertans believe that the amount of revenue that the Alberta government collects from the oil and gas sector is “About Right” (48%) or Too High (13%), the review panel‘s recommendations are considerably worse than many in the industry were anticipating.
Current vs. Proposed Revenue Sharing Split
| |
Current Sharing |
Proposed Sharing |
| |
Alberta's share |
Company share |
Alberta's share |
Company share |
| Oil Sands |
47% |
53% |
64% |
36% |
| Conventional oil |
44% |
56% |
49% |
51% |
| Natural Gas |
58% |
42% |
63% |
37% |
| |
|
|
|
|
| Source: Alberta Royalty Review Panel |
|
|
|
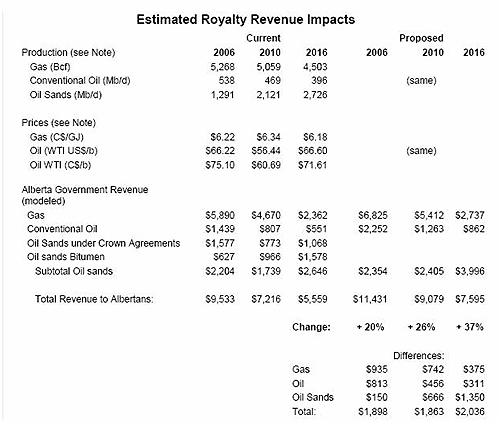
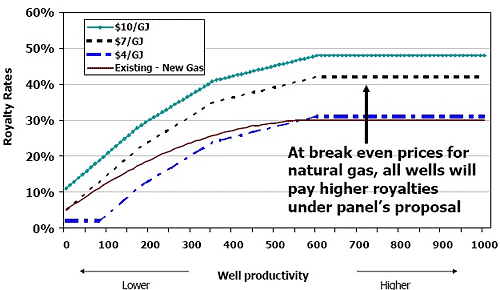
The panel believes that the weighted royalty rate would increase from 24% to 36.1% for the province and that the overall revenue impact from conventional natural gas and crude oil wells would be $935 million (+15.9%) and $813 million (+56.5%) respectively. The panel calculated that this tax increase would be borne by only 18% of the natural gas wells and by 43% of the light oil wells. However, ConocoPhillips has determined that only at an uneconomic natural gas price in the range of $4/mcf do lower productivity wells deliver lower royalties. Therefore, the panel’s recommendations threaten to drive thousands of marginal natural gas wells below the economic threshold and potentially remove them from the province’s royalty base.
Hardest hit were the oil sands where the panel’s recommendations would bring the overall government take to 64% (from 47%) while conventional resources will pay up to 5% more with some concessions for low rate wells.
Revenue Impacts From Proposed Changes, in Cdn Dollars
Source: Alberta Department of Energy
In not allowing grandfathering for existing projects, we are concerned about the longer-term investment implications for Alberta if existing contracts are not honoured. Combining this with the Federal Government Finance Minister’s “Tax Fairness” plan, one can easily imagine the image that Canada is now portraying, not only to the international investment community, but also to internationally focused energy companies looking for attractive places to invest. For example, Encana has stated in a recent press release (Sept. 28, 2007) that it plans to cut its capital investment in Alberta by about $1 billion, or 30 to 40 percent of its 2008 capital budget. Crescent Point Energy Trust has decided to direct its entire $150 million capital budget to Saskatchewan. Their press release (Oct. 2, 2007) points out that increased royalty rates in Alberta will decrease the rates of return on projects in the province, making investments in other jurisdictions more attractive. In an open letter on Oct. 3, 2007 to the Alberta Premier, Jim Buckee of Talisman stated that, if the panel’s recommendations are implemented, the company would cut a further $500 million in capital expenditures beyond the already planned $500 million decrease as a result of low natural gas prices.
Example of Natural Gas Impact From Proposed Royalty Rates
Source: CAPP
Increasing royalty rates in a period when much of the industry is pulling capital out of Canada and drilling less is counter-productive. Weak comparative economics in the WCSB relative to other North American basins makes the case for decreasing royalties not increasing them. However, the panel based its conclusions on a comparison of government take in Alberta to other jurisdictions but ignored relative reserves, geological risk, decline rates, costs, economic return, and access to capital.
When we should be following in the footsteps of the North Sea, where royalty and tax reductions are spurring investment in a region that is experiencing overall declines, we seem to be following the Venezuela model of energy resource management.
The process is not final as the provincial government will now review the proposed changes with a decision expected by mid-October. We expect that there will be some degree of compromise but we do expect that there will be some royalty increase.
With the Canadian dollar reaching parity with the U.S. currency while reserve conversion and bitumen project costs are increasing, more regressive tax environments will shorten projected reserve lives and cause a reduction in investment as more companies opt to go to other basins.
Disclaimer:
This report is intended for clients of Galileo Global Equity Advisors Inc. Galileo Global Equity Advisors Inc. invests on behalf of its clients in the issuers mentioned in this report. Employees of Galileo Global Equity Advisors Inc. may own shares. This document is not intended to sell or promote securities.
Copyright:
All content included on this site, such as text, graphics, logos, button icons, images, and software, is the property of Galileo Global Equity Advisors Inc. or its content suppliers and protected by Canada and international copyright laws. The compilation of all content on this site is the exclusive property of Galileo Global Equity Advisors Inc. and protected by Canadian and international copyright laws.
|